Business Intelligence,
Analytics & Power BI
Turn business data into decisions your teams can act on
Consult an expertTurn business data into decisions your teams can act on
Consult an expert
Dashboards only matter when they help people decide. Many organizations have reporting tools but still struggle with slow reporting cycles, inconsistent metrics, disconnected data, and dashboards that do not answer the questions leaders actually ask.
JBS designs BI and analytics around real decisions. We build Power BI dashboards, reporting models, management views, forecasting, and operational reporting that make performance easier to understand and act on.
Identifying the decisions, KPIs, users, and workflows dashboards need to support.
Dashboards, reports, visualizations, filters, and executive views tailored to leadership and teams.
Consistent metrics, relationships, and reporting structures for one version of the truth.
Recurring management views, board-ready structures, and performance summaries.
Dashboards for work queues, service levels, processing times, bottlenecks, and productivity.
Segmentation, behavior analysis, transaction categorization, and performance views.
Forecasting models, trend analysis, and planning support where the data supports it.
Training, iteration, governance, and managed support to move teams to active dashboard use.
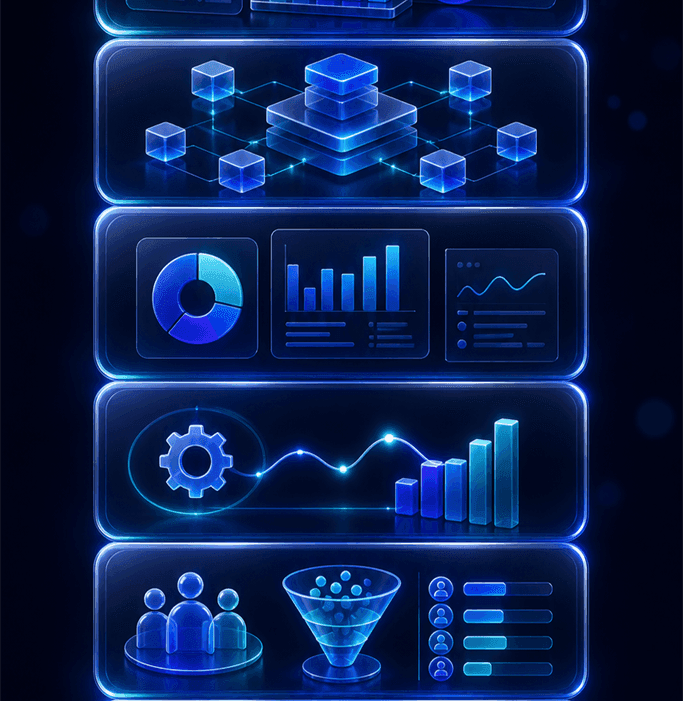
| Dashboard type | What it shows | Typical users |
|---|---|---|
| Executive | High-level KPIs, trends, financial indicators, and performance summaries. | C-suite, business heads, board reporting. |
| Operational | Workflow status, volume, queues, bottlenecks, turnaround, and service performance. | Operations leaders, service managers. |
| Sales and customer | Pipeline, behavior, conversion, retention, revenue, and product adoption. | Sales leaders, customer success, marketing. |
| Finance | Revenue, cost, profitability, cash flow, billing, budgets, and variance. | Finance leaders, controllers. |
| AI and automation | Agent performance, workflow volume, exception handling, and manual-effort reduction. | Transformation leaders, operations, AI owners. |
| Predictive | Forecasts, risk indicators, trends, and early-warning signals. | Planning teams, analysts, leaders. |
JBS transformed visual chart information into structured indicators and datasets, enabling faster, more consistent downstream analysis.
Learn moreJBS built a custom platform that gave teams better visibility into time tracking, billing, and operational performance.
Learn moreJBS delivered conversational analytics inside an enterprise assistant, letting employees query and synthesize information across sources.
Learn moreJBS designed centralized operations visibility across agent-driven claims, service, underwriting, and marketing workflows.
Learn moreJBS connected financial documents, policies, and transaction systems into an AI-assisted platform for faster decisions and access.
Learn moreWe identify the decisions the dashboard supports, the audiences, and the metrics that matter most.
We review data sources, quality, definitions, access, refresh frequency, and reporting pain points.
We create wireframes, sample reports, or a Power BI proof of concept so stakeholders react early.
We develop semantic models, connections, dashboards, visualizations, and reporting flows.
We validate metrics with business users, publish dashboards, configure access, and support adoption.
We maintain dashboards, add metrics, tune performance, and adjust reporting as needs change.


We tie every dashboard to a real decision, so it gets used.

We standardize metrics so teams stop arguing about the numbers.

We replace manual reporting cycles with automated, trusted dashboards.

We support adoption, not just delivery.
The use of data, dashboards, reports, metrics, and visual analytics to help organizations understand performance and decide better.
Connecting data, building dashboards and reports, visualizing performance, and giving teams self-service access to insights across finance, sales, operations, and customers.
It is tied to a real decision, uses trusted data and clear metrics, and has a layout that shows what is happening and what needs attention.
Yes. We replace manual cycles with automated dashboards, recurring management reports, Power BI models, and refresh processes.
BI explains what has happened and what is happening now. Predictive analytics uses historical patterns to forecast outcomes, identify risks, or support planning.
JBS builds Power BI dashboards and analytics that give your teams the visibility to move with confidence.
